NVDA Earnings Options Replay: What the Chain, Quotes, and IV Actually Said

Daniel Ratke
Research & Engineering
NVDA Earnings Options Replay: What the Chain, Quotes, and IV Actually Said
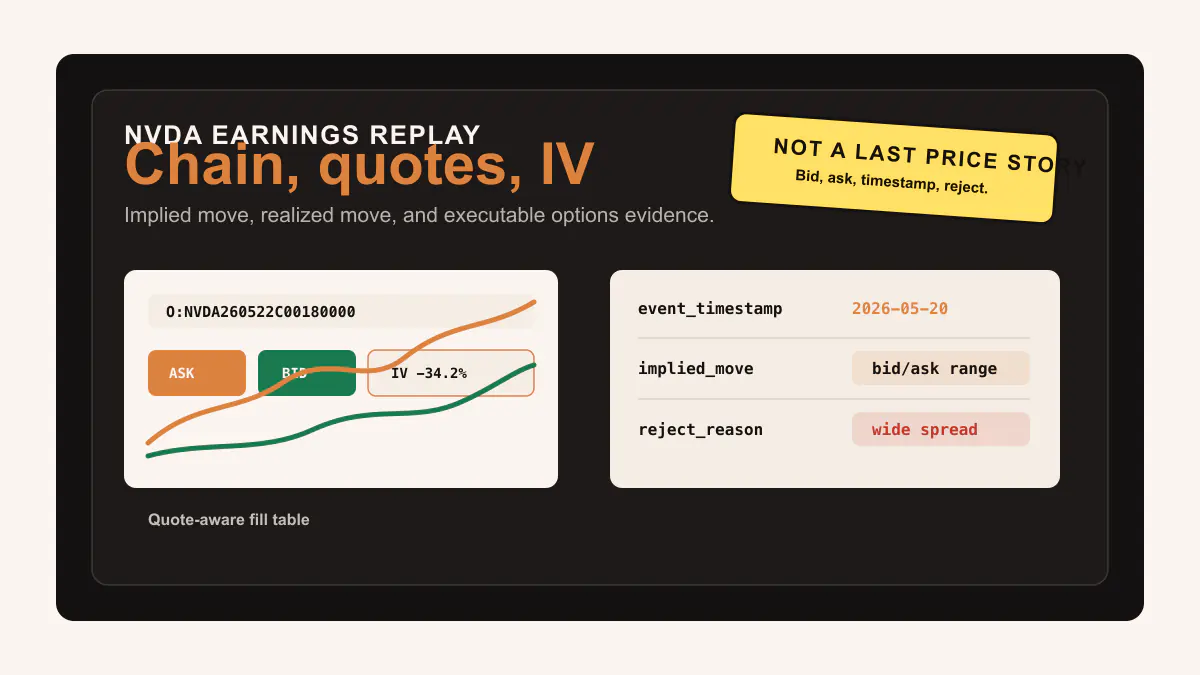
A serious NVDA earnings options replay should start with the listed chain, measure implied move from executable bid/ask data, replay exact contracts through quote windows, and report IV crush beside spread quality, quote freshness, and reject reasons.
Term map
Options-data vocabulary for this article
Read chains, contracts, quote freshness, trade tape context, Greeks, implied volatility, open interest, and entitlement gates as separate data objects. That vocabulary keeps an options-data workflow precise when it moves from docs to scanners, dashboards, and historical research.
Follow the linked definitions for Option chain snapshot, Contract snapshot, Volume/OI pressure, Options flow false positive, Scanner artifact, Historical REST window, Backfill, DTE bucket, Moneyness band, Quote condition, Trade condition, and IV skew.
Read this article with Options Data API, Options Chain API, Historical Options Data API, Options Volume and Open Interest, Options Flow False Positives, and Option Quote and Trade Conditions.
NVIDIA's May 20, 2026 earnings release was exactly the kind of event that makes options data useful and dangerous at the same time. The company reported record first-quarter fiscal 2027 revenue of $81.6 billion and record Data Center revenue of $75.2 billion, according to NVIDIA investor relations. That is the news headline. It is not the research object.
For an options researcher, the better question is narrower: what did the option surface imply before the print, what did the market actually do after it, and which contracts were tradable enough to make the answer meaningful?
This post walks through a quote-aware earnings replay. The goal is not to declare whether NVDA calls or puts were "right." The goal is to show the workflow a developer should use when turning a major earnings event into an auditable options study.
The earnings headline is only the timestamp
Earnings events are tempting because they create a clean before-and-after story. There is a known announcement window, an obvious underlying ticker, a front-week expiration, visible pre-event implied volatility, and a post-event volatility collapse to measure. That structure makes the event easy to narrate.
It does not make the trade easy to measure.
The first mistake is treating the earnings result as the start of the backtest. In a real replay, the earnings release is only one timestamp in a larger event record. A good study needs at least these fields:
| Field | Why it matters |
|---|---|
event_timestamp | The moment the release or call became available to the market. |
pre_event_snapshot_time | The last market state the strategy could observe before the announcement. |
post_event_open_time | The first regular-session window where most equity-option execution can be evaluated. |
underlying_price_before | The stock reference used to identify ATM contracts and implied move. |
underlying_price_after | The realized move anchor for the replay. |
selected_contracts | The exact OCC symbols studied, rather than "NVDA calls." |
quote_windows | Bid/ask evidence around every hypothetical entry and exit. |
reject_reasons | Why contracts or fills were excluded. |
Without that event record, the post becomes a story about NVIDIA. With it, the post becomes a reproducible options-data study.
Build the chain before choosing a contract
An earnings replay should begin with the chain, not with a chart. The chain tells you which contracts were visible, which expirations were listed, where the market concentrated activity, and how implied volatility was distributed across strikes and dates.
For a front-week earnings study, the minimum request sequence is:
curl "https://api.cutemarkets.com/v1/tickers/expirations/NVDA/" \
  -H "Authorization: Bearer YOUR_API_KEY"

curl "https://api.cutemarkets.com/v1/options/chain/NVDA/?expiration_date=2026-05-22&limit=100" \
  -H "Authorization: Bearer YOUR_API_KEY"
The first request protects the workflow from a calendar assumption. The second request gives the chain for the chosen expiration. In production code, the chain response should be paginated until all relevant strikes are loaded, then filtered locally by moneyness, spread, open interest, volume, and IV availability.
The important thing is the order. You do not start with a made-up OCC symbol. You discover the listed dates, load the chain, then select contracts from the actual response.
Measure the implied move from the ATM straddle
The simplest earnings benchmark is the at-the-money straddle. Find the call and put closest to the underlying reference price, add their premiums, then divide by the underlying price:
implied_move_dollars = call_mid + put_mid
implied_move_percent = implied_move_dollars / underlying_price_before
That formula is only useful if the premiums are measured honestly. A last price can be stale. A midpoint can be theoretical. A wide market can make the implied move look precise when the executable range is not precise at all.
For a serious replay, compute at least three implied-move estimates:
| Estimate | Formula | Interpretation |
|---|---|---|
| Mid straddle | call_mid + put_mid | Clean theoretical reference when markets are tight. |
| Buy straddle | call_ask + put_ask | Cost to enter long vol aggressively. |
| Sell straddle | call_bid + put_bid | Proceeds available to sell vol aggressively. |
If the mid straddle implies a 6% move but the buy-side straddle costs 6.8% and the sell-side straddle yields 5.3%, the useful conclusion is not "the implied move was 6%." The useful conclusion is that the execution interval was wide enough to matter.
Compare front-week and next-week IV
Earnings risk usually concentrates in the nearest expiration that captures the event. For NVDA, a replay should compare the May 22, 2026 expiration against later expirations such as May 29 or June 5, assuming those dates appear in the listed expiration response.
The question is more than which IV was highest. The better questions are:
- How much extra IV did the event week carry over the next weekly?
- Did IV concentrate near the money or stay elevated across a wide strike range?
- Were deep out-of-the-money contracts liquid enough to study, or were they mostly lottery tickets?
- Did volume concentrate in one side of the chain, or did both calls and puts trade actively?
- Did open interest reflect existing positioning, or did same-day volume dominate the picture?
Those answers help separate event premium from generic single-name volatility. They also keep the backtest from pretending that the cheapest far-out-of-the-money contract was a clean expression of the earnings thesis.
Do not let volume choose the trade by itself
Earnings weeks create noisy leaderboards. A contract can rank near the top by volume because it was a hedge roll, a closing trade, a cheap far-out-of-the-money flyer, or a retail favorite. High volume is evidence of attention. It is not evidence of edge.
A better contract shortlist combines activity with execution quality:
| Filter | Why it belongs in the shortlist |
|---|---|
| Moneyness band | Keeps the study focused on contracts that plausibly express the event. |
| Minimum open interest | Avoids contracts with no established market. |
| Minimum same-day volume | Confirms the line is active during the event window. |
| Maximum spread percentage | Prevents tiny-premium contracts from dominating with untradable spreads. |
| Quote freshness | Rejects stale bid/ask rows. |
| Minimum bid | Avoids zero-bid or near-zero-bid exits. |
| IV present | Allows the study to measure crush instead of only price change. |
The output should not be one magical contract. It should be a small panel: ATM call, ATM put, one near-out-of-the-money call, one near-out-of-the-money put, and optionally the front-week ATM straddle. That is enough to understand the event without overfitting the replay to the best post-hoc winner.
Replay exact contracts, not ticker-level ideas
Once the shortlist exists, every replay row should name the exact contract ticker. The following examples are placeholders. In a real study, replace them with tickers returned by the chain response.
curl "https://api.cutemarkets.com/v1/options/quotes/O:NVDA260522C00180000/?timestamp.gte=2026-05-20T19:30:00Z×tamp.lt=2026-05-20T20:00:00Z&limit=1000" \
-H "Authorization: Bearer YOUR_API_KEY"
curl "https://api.cutemarkets.com/v1/options/quotes/O:NVDA260522P00180000/?timestamp.gte=2026-05-20T19:30:00Z×tamp.lt=2026-05-20T20:00:00Z&limit=1000" \
-H "Authorization: Bearer YOUR_API_KEY"
curl "https://api.cutemarkets.com/v1/options/trades/O:NVDA260522C00180000/?timestamp.gte=2026-05-20T19:30:00Z×tamp.lt=2026-05-21T20:00:00Z&limit=1000" \
-H "Authorization: Bearer YOUR_API_KEY"
There are two separate windows in that example:
- A pre-event quote window, used to estimate what could have been entered before the print.
- A post-event trade or quote window, used to inspect what happened after the event.
For fills, quotes are the primary evidence. Trades are supporting context. If a contract printed at a price but the bid/ask market was nowhere near that price when your strategy needed to exit, the trade print does not rescue the backtest.
The IV crush needs a tradable denominator
Most earnings options posts talk about IV crush as if it were a simple before-and-after chart. That hides the hard part. The IV drop only matters if the contract was tradable before and after the event.
A good replay should report IV crush next to executable pricing:
| Metric | Pre-event | Post-event | Why it matters |
|---|---|---|---|
implied_volatility | Chain IV before release | Chain IV after release | Measures volatility repricing. |
bid / ask | Quote window before release | Quote window after release | Shows whether the contract could be entered/exited. |
midpoint | Derived from bid/ask | Derived from bid/ask | Useful but not enough by itself. |
spread_percent | Spread divided by midpoint | Spread divided by midpoint | Captures execution drag. |
quote_age_ms | Age at decision time | Age at exit time | Rejects stale markets. |
volume | Activity before event | Activity after event | Confirms market participation. |
The key is to avoid reporting IV crush in isolation. A contract can show a dramatic IV decline and still be a bad replay candidate if the pre-event spread was too wide or the post-event bid disappeared.
Realized move is not the same as option PnL
The underlying realized move is the cleanest summary statistic. If NVDA moved less than the straddle implied, long premium likely had a difficult setup. If it moved more, short premium likely had a difficult setup. That framing is useful, but it is still incomplete.
Option PnL depends on:
- direction
- magnitude
- time to expiration
- IV change
- moneyness
- spread paid at entry
- spread paid at exit
- whether the contract had a real bid after the event
- whether execution happened before or after the market repriced
This is why a call can be directionally correct and still disappoint. It can pay too much event premium, lose too much IV, or enter a contract whose spread consumes the realized move. It is also why a put can be wrong directionally but not go to zero immediately if the option was long enough dated and the IV surface moved differently than expected.
The replay should therefore avoid binary language like "calls won" or "puts lost." It should report the chain state, the realized move, and the fill-aware result for each selected contract.
A simple replay table
For a long-form post, the most useful table is not a massive chain dump. It is a compact panel that readers can audit:
| Contract role | Entry side | Exit side | Entry quote | Exit quote | IV change | Spread reject? | Result |
|---|---|---|---|---|---|---|---|
| ATM call | Ask | Bid | Pre-event quote | Post-event quote | Down/up | Yes/no | PnL after spread |
| ATM put | Ask | Bid | Pre-event quote | Post-event quote | Down/up | Yes/no | PnL after spread |
| ATM straddle | Ask+ask | Bid+bid | Pre-event quotes | Post-event quotes | Down/up | Yes/no | Combined PnL |
| OTM call | Ask | Bid | Pre-event quote | Post-event quote | Down/up | Yes/no | PnL after spread |
| OTM put | Ask | Bid | Pre-event quote | Post-event quote | Down/up | Yes/no | PnL after spread |
That table is intentionally strict. Long option entries buy at ask and exit at bid. Short option entries sell at bid and buy back at ask. You can add midpoint marks as a sensitivity column, but they should not be the headline result unless the post is explicitly about theoretical marks rather than executable replay.
What to reject
The most important rows in an earnings replay may be the rejected rows. Earnings weeks produce a lot of data, but not all of it is fit for a research claim.
Reject a contract or fill when:
- the option was not listed at the decision time
- the quote is missing near the decision timestamp
- the quote is older than the allowed freshness threshold
- the spread exceeds the maximum allowed spread percentage
- the bid is zero or below the minimum exit threshold
- the chain row lacks IV or Greeks needed by the study
- the selected strike is outside the intended moneyness band
- the contract has too little volume or open interest for the claim being made
- the response is paginated and the workflow did not load all needed pages
These rejections make the post less flashy. They also make it more useful. A replay that can explain why it did not trade is much more credible than a replay that silently drops inconvenient contracts.
The developer workflow
A full NVDA earnings replay should be a pipeline, not a notebook full of isolated requests:
- Create an event record for the May 20, 2026 release.
- Fetch listed expirations for NVDA.
- Load the front-week and comparison-week chains.
- Identify ATM, near-OTM, and high-activity contracts from the chain.
- Fetch pre-event quote windows for selected contracts.
- Fetch post-event quote windows for the same contracts.
- Fetch trades for tape context and activity validation.
- Compute implied move, realized move, IV change, spread cost, and fill-aware PnL.
- Record rejects with exact reasons.
- Publish the table with enough fields for another developer to reproduce it.
The CuteMarkets endpoints map cleanly to that flow:
- Expirations find the listed dates before the study assumes a weekly exists.
- Option Chain Snapshot loads strikes, IV, Greeks, open interest, latest quotes, and latest trades.
- Contracts verifies exact contract identity and historical reference data.
- Quotes provide bid/ask evidence for fill realism.
- Trades validate printed activity and event tape context.
This is also the workflow behind Earnings Options Plays, Scientifically. The difference here is that NVDA gives the framework a fresh, high-attention event where the cost of sloppy assumptions is easy to see.
Why last price is especially bad around earnings
Last price is risky in ordinary options research. It is worse around earnings.
The reason is simple: the market can reprice faster than trades print evenly across the chain. A contract's last sale may come from before the release, from a brief liquidity pocket, from a small retail execution, or from a moment when the NBBO had already moved. If the replay uses that last price as the exit, it may accidentally fill at a market that was not available to the strategy.
This is why the companion post Why Option Quotes Matter More Than Last Price is more than a general principle. It is the rule that keeps an earnings replay from becoming a hindsight chart.
What the post should conclude
The right conclusion for an NVDA earnings replay is not a trade recommendation. It is a research standard:
- The earnings release is the event timestamp, not the full study.
- The implied move should be measured from executable bid/ask data, not stale last sales.
- The exact contracts matter more than the ticker-level story.
- IV crush should be reported beside spreads, quote freshness, and bid availability.
- Rejected contracts should stay visible in the artifact.
Major earnings events force every part of the options-data stack to work at once. If the chain, quotes, trades, timestamps, and rejects all agree, the replay becomes evidence. If they do not, the right answer is to publish the mismatch instead of smoothing it away.
Sources and next reads
- NVIDIA Q1 fiscal 2027 results
- Earnings Options Plays, Scientifically
- Why Option Quotes Matter More Than Last Price
- Option Chain Snapshot docs
- Quotes docs
- Trades docs
How the terminology applies
For NVDA Earnings Options Replay: What the Chain, Quotes, and IV Actually Said, the options data workflow should treat Option chain snapshot, Contract snapshot, Volume/OI pressure, Options flow false positive, Scanner artifact, and Historical REST window as operational state rather than glossary decoration. That framing keeps chain selection, contract snapshots, activity filters, quote state, and endpoint access tied to the exact contract the page is discussing.
A developer implementing this Deep Dive idea should persist Backfill, DTE bucket, Moneyness band, Quote condition, Trade condition, and IV skew beside the result, instead of leaving those words in a term card. It also makes false positives easier to diagnose because a high-activity contract can be separated from a tradable, timestamped, and entitled data object.
The review artifact for NVDA Earnings Options Replay: What the Chain, Quotes, and IV Actually Said becomes more useful when 0DTE contract, OCC root, Options data API, OPRA-originating data, OCC option symbol, and Bid/ask spread appear in the same body of evidence as the selected rows. When the article moves from concept to implementation, these fields should shape request order, cache boundaries, row labels, and review tables.
In production notes for this options data workflow, Midpoint, Quote/trade condition, Quote vs trade semantics, REST snapshot, WebSocket stream, and Entitlement gate define the checks that decide whether the workflow is reproducible. The result is a scanner or dashboard that explains why a contract was shown, skipped, refreshed, or passed into a downstream research step.
For NVDA Earnings Options Replay: What the Chain, Quotes, and IV Actually Said, the practical acceptance test is simple: another developer should be able to read the body, identify the exact inputs, reproduce the request sequence, and explain the accepted and rejected rows without relying on the bottom terminology grid. If a phrase appears in the page vocabulary, it should correspond to a stored field, a validation check, a replay step, or an implementation decision in the options data workflow.
This is also the reason the article should not measure success only by the final chart, table, or headline metric. The better standard is whether the data path, timing model, entitlement state, and evidence trail survive review. When those pieces are written directly into the body, the terminology becomes part of the workflow readers can implement.
Terminology
Market-data terms used in this article
These terms keep the article connected to the CuteMarkets knowledge base and to the exact API workflow behind the research.
Option chain snapshot
The current breadth view for an underlying across expirations, strikes, Greeks, IV, OI, quotes, and trades.
Contract snapshot
The focused one-leg view after a chain scanner or user selects an exact contract.
Volume/OI pressure
Same-day option volume divided by prior open interest, used as an attention filter rather than proof of new positioning.
Options flow false positive
A scanner row that looks meaningful but weakens after spread, quote age, event, trade, or structure checks.
Scanner artifact
The saved contract, score, volume, OI, premium, quote, trade, tag, and reject record behind an alert.
Historical REST window
A timestamp-bounded request for quotes, trades, contracts, or bars used to rebuild a past market state.
Backfill
A REST request used after a stream gap, retry, or missing cache hit to repair an interval explicitly.
DTE bucket
A days-to-expiration grouping such as 0DTE, weekly, monthly, LEAPS, or event-window contracts.
Moneyness band
The ITM, ATM, or OTM relationship between strike, contract side, underlying price, and delta.
Quote condition
A code attached to a bid/ask update that affects whether it belongs in scanners, backtests, or displayed state.
Trade condition
A code attached to a print that affects whether the last sale is regular, corrected, excluded, or only contextual.
IV skew
The shape of implied volatility across strikes or expirations, usually read with Greeks and term-structure context.
0DTE contract
An option that expires the same trading day and needs tighter spread, quote-age, and session-state controls.
OCC root
The symbol root inside the OCC option identifier, which can differ from casual ticker text in adjusted or special cases.
Options data API
The product surface for chains, contracts, quotes, trades, aggregates, Greeks, IV, open interest, and expirations.
OPRA-originating data
The U.S. listed-options source context behind quotes, trades, exchange participation, and consolidated option-market records.
OCC option symbol
The exact option contract identifier that preserves root, expiration, call or put side, and strike.
Bid/ask spread
The execution interval between bid and ask that determines whether a contract is realistically tradable.
Midpoint
The computed center between bid and ask, useful as a reference price but not proof that an order would fill.
Quote/trade condition
The condition-code, exchange, correction, sequence, and timestamp context that explains how a quote or trade row can be used.
Quote vs trade semantics
The distinction between executable bid/ask markets, printed transactions, and bar-level summaries.
REST snapshot
A reproducible request for current or historical market state, used for initialization, backfills, and audit logs.
WebSocket stream
A persistent live connection that needs subscription topics, reconnect tracking, freshness labels, and REST repair paths.
Entitlement gate
The product, plan, quote, live, delayed, historical, or commercial-use boundary checked before data is shown.
FAQ
Related questions
How should developers study NVDA earnings options?
Start from listed expirations and the option chain, shortlist exact contracts, measure the ATM straddle from bid/ask quotes, then replay entries and exits with quote-aware fills and explicit reject reasons.
Why is last price weak for earnings options?
Last price can be stale around earnings because the chain reprices quickly and trades do not print evenly across every strike. Bid/ask quotes show what market was actually available near the decision timestamp.
Written by
Daniel Ratke
Research & Engineering
Daniel covers the deeper research notes: options backtesting, execution realism, robustness testing, data engineering, and strategy validation.
Product links
Build the workflow with CuteMarkets
This article is part of the broader CuteMarkets product and research stack. Use the landing pages below to move from the blog into the specific API workflow you want to evaluate.
Beginner options path
Send newcomers to the beginner path for calls, puts, chains, Greeks, IV, and risk.
Options Data API
See the main options overview for real-time and historical options data.
Historical Options Data API
Inspect the historical contracts, quotes, trades, and aggregates workflow.
Options Chain API
Go straight to chain snapshots, expirations, and strike discovery.
Pricing
Review plans before you move from free evaluation into production usage.